Dashboard Implementation Examples
This document provides additional views of the Home Assistant monitoring system that implements the baseline calculations and thresholds documented in this repository.
Runtime Analysis
Floor-by-Floor Comparison
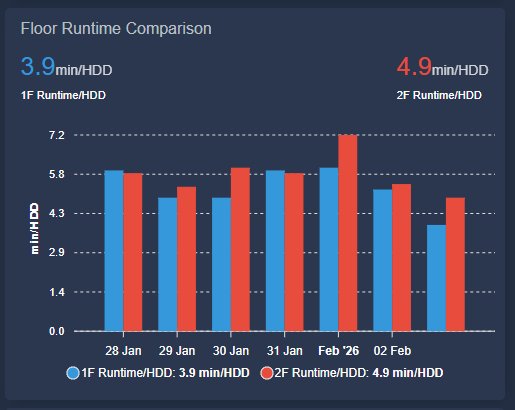 Multi-zone runtime tracking showing balanced heat distribution between 1F and 2F zones
Daily Efficiency Trending
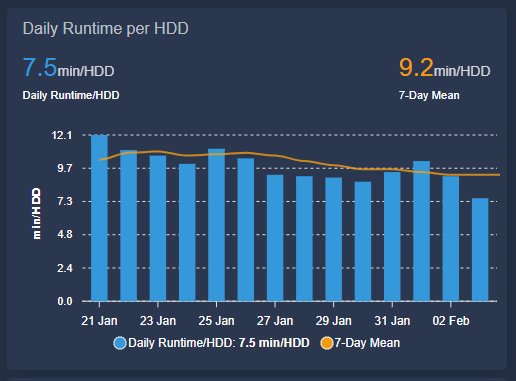 Day-by-day efficiency trending with 7-day moving average. The orange line represents the 7-day mean (9.2 min/HDD), used to smooth daily weather variations and identify longer-term performance drift.
Cycle Analysis
Today’s Furnace Operation
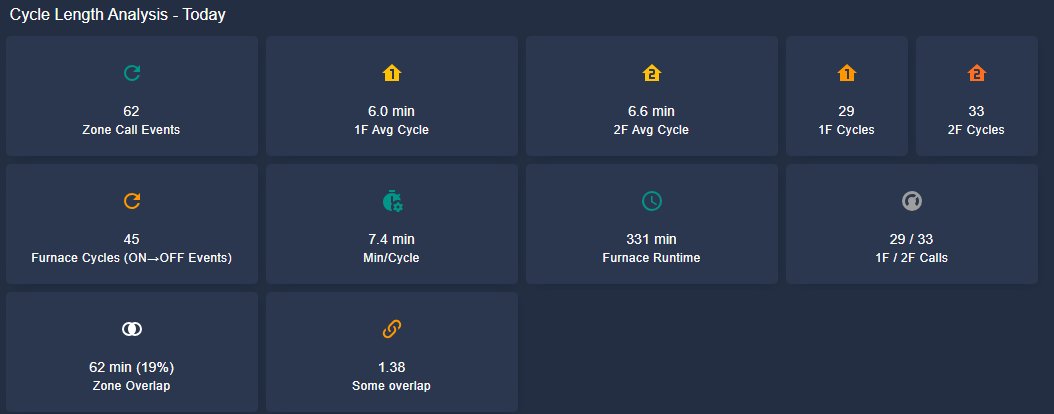 Real-time view of today’s furnace operation showing zone call events (62 total), average cycle lengths (6.0 min for 1F, 6.6 min for 2F), and zone overlap metrics (1.38 overlap index indicating moderate zone coordination)
Current Status Summary
 Current operational status with runtime per HDD (7.4 min/HDD) and zone balance gauge (55.6% to 2F, indicating balanced operation within target range of 55-60%)
Implementation Notes
These dashboards are built using:
- Platform: Home Assistant 2024.x with YAML configuration
- Sensor Framework: Template sensors for all calculations
- UI Components: Custom Lovelace cards (gauge, history-graph, entities, markdown)
- Data Persistence: SQLite recorder with 365-day retention + CSV exports for long-term analysis
- Update Frequency: Runtime sensors update every 1 minute, statistical calculations update every 5 minutes
Technical Architecture
text
┌─────────────────────────────────────────────────────────┐
│  Honeywell Lyric T6 Pro Thermostat (2 zones)           │
└──────────────────┬──────────────────────────────────────┘
                   │
                   │ Local API integration
                   ▼
┌─────────────────────────────────────────────────────────┐
│  Home Assistant Core                                    │
│  ├─ Thermostat Integration (runtime, setpoint, temp)   │
│  ├─ Weather Integration (outdoor temp, NOAA data)      │
│  └─ Template Sensors (HDD, efficiency, statistics)     │
└──────────────────┬──────────────────────────────────────┘
                   │
                   │ Recorder (SQLite)
                   ▼
┌─────────────────────────────────────────────────────────┐
│  Frontend Dashboards                                    │
│  ├─ Performance Gauges                                  │
│  ├─ Efficiency Tracking (SPC charts)                   │
│  ├─ System Alerts                                       │
│  └─ Cycle Analysis                                      │
└─────────────────────────────────────────────────────────┘
                   │
                   │ CSV Export Automation
                   ▼
┌─────────────────────────────────────────────────────────┐
│  Long-term Analysis                                     │
│  └─ This repository (baseline calculations & reports)  │
└─────────────────────────────────────────────────────────┘
text
The complete configuration including sensor definitions, automations, dashboard YAML, and export scripts is available in the home-assistant-config repository.
Performance Baseline Integration
All statistical bounds (±2σ), target values, and alert thresholds shown in these dashboards are derived from the four-year analysis documented in BASELINE_REPORT.md.
Baseline Mapping
| Dashboard Metric | Baseline Source | Current Value (Feb 2026) | Alert Threshold |
|---|---|---|---|
| Runtime/HDD (7-day mean) | Historical 4-year analysis | 9.2 min/HDD | ±2σ from rolling mean (6-14 min/HDD) |
| CCF/1k HDD | Billing-aligned heating intensity | 95.5 CCF/1k HDD | +10% (>105 CCF/1k HDD) |
| Site EUI | Calendar year energy use intensity | 41.7 kBTU/ft²-yr | ±5% (39.6-43.8 kBTU/ft²-yr) |
| Building UA | Calculated envelope conductance | 378 BTU/hr-°F | N/A (reference only) |
| Zone Balance (2F %) | Equipment sizing & distribution | 55-60% target | <45% or >65% (unbalanced) |
Statistical Process Control Implementation
The efficiency tracking dashboard implements SPC using:
- Center line: 7-day rolling mean (smooths daily weather noise)
- Upper control limit: Mean + 2σ (14 min/HDD as of Feb 2026)
- Lower control limit: Mean - 2σ (6 min/HDD as of Feb 2026)
Control limits are recalculated weekly using the trailing 30-day dataset. This allows the system to adapt to seasonal changes in furnace efficiency while maintaining sensitivity to anomalies.
Use Cases
1. Real-time Anomaly Detection
When runtime/HDD exceeds the upper control limit for 2+ consecutive days, the system generates an alert for investigation. Potential causes:
- Dirty air filter (most common)
- Thermostat miscalibration
- Duct leakage
- Extreme outdoor temperatures not reflected in HDD calculation
2. Equipment Degradation Tracking
Comparing current 7-day mean (9.2 min/HDD) against historical baseline (9.1 min/HDD from 2022-2025) provides early indication of:
- Heat exchanger fouling
- Blower motor wear
- Duct system deterioration
3. Contractor Communication
Dashboard screenshots provide verifiable data for HVAC service calls:
- “System is running 18% longer than baseline - recommend filter check”
- “Zone balance has shifted to 68% 2F - check damper operation”
- “Recovery rate degraded from 4.2°F/hr to 3.1°F/hr - possible refrigerant issue”
4. Energy Monitoring ROI Justification
The unresolved 21% baseload (1,420 kWh/year, $326 annually) drives the business case for circuit-level monitoring. Dashboard demonstrates:
- HVAC loads are well-characterized and efficient
- Mystery load is elsewhere in the electrical system
- Whole-home monitoring (Fusion Solar 16-CT) is justified to identify optimization opportunities
Future Enhancements
Planned monitoring additions:
- Circuit-level electricity tracking via Fusion Solar monitor (16 CTs)
- DHW efficiency monitoring using Navien NaviLink gas meter integration
- Predictive maintenance alerts using equipment runtime hours and manufacturer service intervals
- Weather-adjusted comfort scoring combining temperature, humidity, and setpoint achievement
- Monthly report generation with automatic comparison to baseline metrics
Related Documentation
- Baseline Analysis: BASELINE_REPORT.md
- Methodology: METHODOLOGY.md
- Raw Data: data/README.md
- Home Assistant Config: home-assistant-config
Last Updated: February 2026
Configuration Version: Home Assistant 2024.12
Monitoring Active Since: January 2025