Residential HVAC Performance Baseline
A Five-Year Longitudinal Study of High-Efficiency Residential Energy Systems in Climate Zone 5A
![]()
![]()
![]()
![]()
![]()
Overview
This repository documents a comprehensive energy performance baseline for a 2,440 sq. ft. high-efficiency residential structure in Central Connecticut (Climate Zone 5A). The analysis integrates 50 months of verified utility data (January 2022 - February 2026), high-resolution HVAC runtime telemetry, and independent domestic hot water monitoring to establish diagnostic performance thresholds.
Key Findings (Updated February 2026):
- Site EUI (12-mo rolling): 42.8 kBTU/ft²-yr (31% better than regional average)
- Baseline Site EUI: 41.7 kBTU/ft²-yr — current +2.6% due to colder winter
- Heating Intensity: 90.3 CCF/1k HDD (corrected with Navien DHW metering)
- Envelope UA: 480 BTU/hr-°F (21-34% superior to 2021 IECC code-minimum)
- 12-mo Electricity: 6,741 kWh (65% below average for home size)
- DHW Optimization: -22% sustained YoY from recirculation schedule change (~$77/year savings)
🆕 February 2026 Update Highlights
February 2026 continued the colder-than-normal 2025-2026 heating season, with an early-month cold snap (Feb 7-9) reaching 0°F:
| Metric | Feb 2025 | Feb 2026 | YoY Change | Status |
|---|---|---|---|---|
| Total Gas | 154 CCF | 175 CCF | +13.6% | ✅ Weather-driven |
| Space Heating | 135.9 CCF | 160.9 CCF | +18.4% | ✅ Tracks weather |
| DHW (Navien) | 18.1 CCF | 14.1 CCF | -22.0% | ✅ Savings hold |
| Weather Severity | 940 HDD | 1,077 HDD | +14.6% | ⚠️ Colder |
| HVAC Runtime | 138 hrs | 158 hrs (8.8 min/HDD) | +14.5% | ✅ Excellent |
Key Insights:
- DHW savings sustained: -22% YoY continues from January optimization
- Runtime efficiency excellent: 8.8 min/HDD is 19% better than baseline
- Season totals: 720 heating hours across 4,529 HDD (Oct-Feb)
DHW Recirculation Optimization (Ongoing)
Cumulative Savings (Jan-Feb 2026): 9.05 CCF (~$14.50) On Track For: ~$77/year projected annual savings Schedule: 15 hr/day (off 9 PM - 6 AM) — no comfort issues reported
See FEBRUARY_2026_UPDATE.md for complete analysis. See JANUARY_2026_UPDATE.md for DHW optimization details.
🏗️ System Architecture
flowchart TB
    subgraph inputs["📡 Data Sources"]
        T1["🌡️ 1F Thermostat<br/>Honeywell T6 Pro"]
        T2["🌡️ 2F Thermostat<br/>Honeywell T6 Pro"]
        PW["🌤️ Pirate Weather API"]
        OM["🌤️ Open-Meteo API"]
        CN["📊 Climate Norms<br/>18-year historical"]
    end

    subgraph ha["🏠 Home Assistant Core"]
        direction TB
        RT["Runtime Tracking<br/>• 1F/2F heat cycles<br/>• Furnace runtime<br/>• Zone overlap"]
        DD["Degree Day Calc<br/>• HDD65/CDD65<br/>• 7-day rolling<br/>• Monthly cumulative"]
        SPC["Statistical Process Control<br/>• Rolling mean ± 2σ<br/>• Anomaly detection<br/>• Control charts"]
        REC["Recovery Analysis<br/>• Setback recovery time<br/>• Weather-adjusted rates<br/>• Per-zone tracking"]
    end

    subgraph outputs["📤 Outputs"]
        CSV["📝 CSV Reports<br/>Daily + Monthly"]
        ALERT["🚨 Alerts<br/>Efficiency deviation<br/>Filter replacement"]
        DASH["📊 Dashboards<br/>ApexCharts + Mushroom"]
        GH["🐙 GitHub Archive"]
    end

    T1 --> RT
    T2 --> RT
    PW --> DD
    OM --> DD
    CN --> SPC
    RT --> SPC
    DD --> SPC
    RT --> REC

    SPC --> CSV
    SPC --> ALERT
    SPC --> DASH
    CSV --> GH
🎯 What Makes This Different
| Traditional Monitoring | This Approach |
|---|---|
| “Your furnace ran 4 hours today” | “Your furnace ran 12% more than expected for today’s weather” |
| Static efficiency thresholds | Rolling ±2σ control limits that adapt to your home |
| Single-zone analysis | Chaining Index quantifies multi-zone coordination |
| Compare to yesterday | Compare to 18-year climate normals for this date |
| Equipment-focused | Post-Program Efficiency framework for already-efficient homes |
📊 Five-Year Performance Summary
| Metric | 2022 | 2023 | 2024 | 2025 | 2026 YTD |
|---|---|---|---|---|---|
| Annual Gas (CCF) | 815 | 764 | 694 | 787 | 343* |
| Annual Elec (kWh) | 6,824 | 6,591 | 6,543 | 6,730 | 919* |
| Heating Intensity | 89.8 | 90.8 | 80.3 | 95.5 | 135.0* |
| Site EUI | 42.1 | 40.8 | 38.2 | 41.7 | — |
*Jan-Feb 2026 only (partial year)
Statistical Stability (4-Year Baseline)
| Metric | Mean | Std Dev | CV (%) | Status |
|---|---|---|---|---|
| Heating Intensity (CCF/1k HDD) | 89.1 | 6.2 | 7.0% | ✅ Excellent |
| Site EUI (kBTU/ft²-yr) | 40.8 | 2.1 | 5.1% | ✅ Excellent |
| Electricity Baseload | 9.6 kWh/day | 0.3 | 3.1% | ✅ Exceptional |
🚀 Quick Start (Home Assistant Users)
For the full Home Assistant configuration that powers the sensors, dashboards, and automation used to generate this dataset, see the companion repo: wkcollis1-eng/home-assistant-config.
Option 1: Full Package (Recommended)
curl -o /config/packages/hvac_baseline.yaml \
  https://raw.githubusercontent.com/wkcollis1-eng/Residential-HVAC-Performance-Baseline-/main/homeassistant/packages/hvac_baseline.yaml
Option 2: Core Sensor (5 minutes)
The single most useful efficiency metric:
template:
  - sensor:
      - name: "HVAC Runtime per HDD Today"
        unique_id: hvac_runtime_per_hdd_today
        unit_of_measurement: "min/HDD"
        state: >
          {% set runtime_hours = states('sensor.YOUR_HEAT_RUNTIME_TODAY') | float(0) %}
          {% set outdoor_mean = (states('sensor.YOUR_OUTDOOR_HIGH') | float(0) +
                                 states('sensor.YOUR_OUTDOOR_LOW') | float(0)) / 2 %}
          {% set hdd = [65 - outdoor_mean, 0] | max %}
          {{ ((runtime_hours * 60) / hdd) | round(1) if hdd > 0 else 0 }}
📁 Repository Structure
├── README.md                     # This file
├── BASELINE_REPORT.md            # Complete technical analysis (17,000+ words)
├── DATA_SUMMARY.md               # Quick-reference metrics and tables
├── METHODOLOGY.md                # Billing-aligned calculation methodology
├── SYSTEM_SPECIFICATIONS.md      # Equipment technical specifications
├── JANUARY_2026_UPDATE.md        # January 2026 performance analysis
├── FEBRUARY_2026_UPDATE.md       # 🆕 February 2026 performance analysis
├── REALTIME_MONITORING_2026.md   # Home Assistant implementation details
├── homeassistant/                # Home Assistant configuration
│   ├── packages/
│   │   └── hvac_baseline.yaml
│   └── dashboards/
└── data/                         # Raw operational datasets
    ├── daily_temperature.csv     # 🆕 Updated through Feb 2026
    ├── monthly_hvac_runtime.csv  # 🆕 Updated through Feb 2026
    ├── monthly_dhw_navien.csv    # 🆕 Updated through Feb 2026
    ├── monthly_electricity_eversource.csv
    └── monthly_gas_scg.csv
🏠 Property Context
| Attribute | Specification |
|---|---|
| Location | Central Connecticut, Climate Zone 5A |
| Construction | 2021, Two-story Colonial |
| Conditioned Area | 2,440 sq. ft. |
| Occupancy | 2 residents |
| Primary Heating | American Standard Silver 95 (96% AFUE) condensing gas furnace |
| Primary Cooling | American Standard Silver 14 (4-ton, 14 SEER) split system |
| Zoning | 2-zone (1F/2F) with Honeywell T6 Pro thermostats |
| Moisture Control | Santa Fe Classic dehumidifier (110 PPD, 700W) |
| DHW | Navien NPE-series condensing tankless |
📈 Investigation Thresholds (2026)
| Metric | Baseline | Warning (+10%) | Action (+15%) |
|---|---|---|---|
| Heating Intensity | 90.3 CCF/1k HDD | >99 | >104 |
| Runtime Efficiency | 10.9 min/HDD | >12.0 | >12.5 |
| Monthly Space Heat (Jan) | 138 CCF | >152 | >159 |
| Monthly DHW (Jan) | 22.8 CCF | >25.1 | >26.2 |
| Zone Imbalance | 50% ±5% | <42% or >58% | <38% or >62% |
Live Monitoring Implementation
The baseline analysis feeds into a real-time Home Assistant monitoring system that tracks performance against established thresholds using Statistical Process Control (SPC). This implementation demonstrates how the calculated baselines translate into operational anomaly detection.
Dashboard Overview
The monitoring system provides continuous validation of system performance:
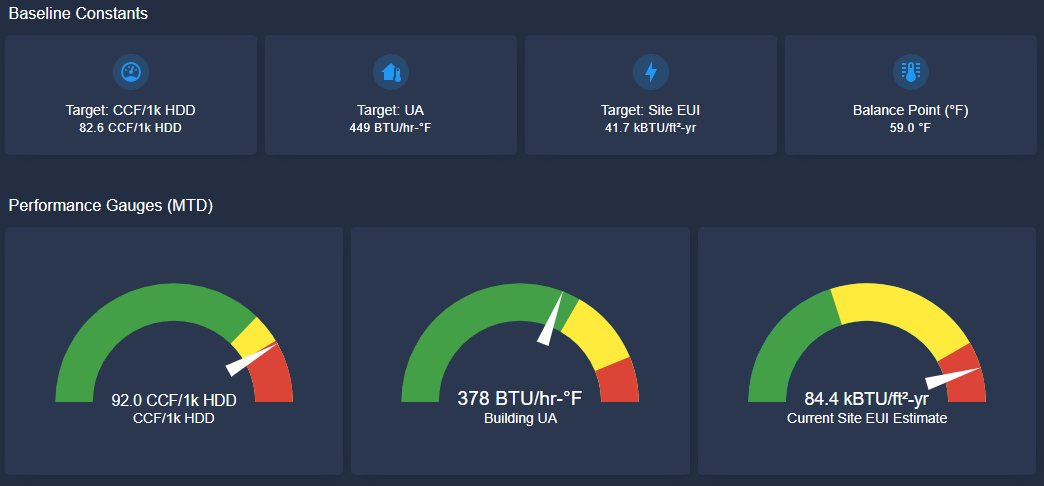 Real-time performance tracking against baseline targets with color-coded status indicators
![]() Statistical Process Control monitoring showing 7-day rolling means and ±2σ bounds derived from baseline analysis
Statistical Process Control monitoring showing 7-day rolling means and ±2σ bounds derived from baseline analysis
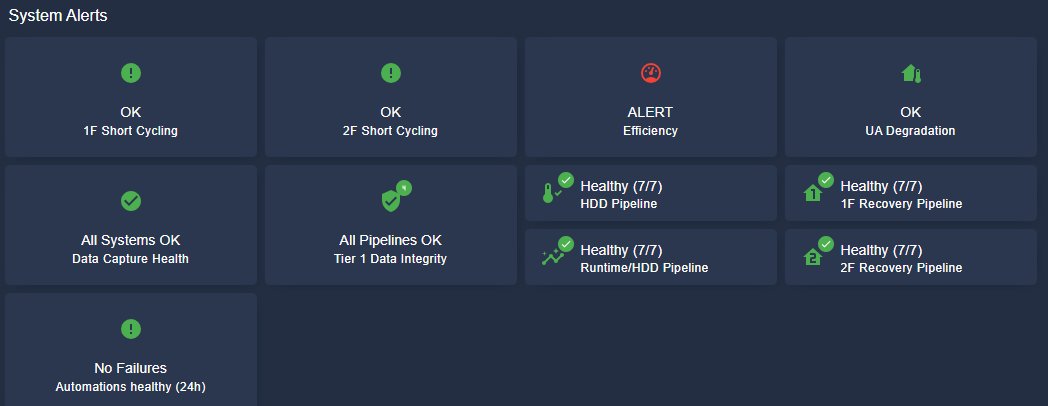 Automated health checks ensuring data capture integrity and alerting on efficiency degradation
Key Monitoring Features
- HDD/CDD Tracking - Heating/cooling degree days with 7-day rolling averages
- Efficiency Monitoring - Runtime per HDD with auto-calculated ±2σ statistical bounds
- Recovery Rate Analysis - Setback recovery tracking with weather adjustment
- Zone Balance Analysis - 1F/2F runtime distribution and cycle overlap detection
- Filter Tracking - Runtime-based maintenance alerts
- Anomaly Detection - Automated alerts when performance drifts beyond baseline thresholds
Full monitoring configuration and implementation details:
📂 home-assistant-config
For additional dashboard views and implementation notes, see DASHBOARD_EXAMPLES.md.
⚠️ Why Standard Utility Programs Don’t Apply
This home’s exceptional performance (41.7 kBTU/ft²-yr EUI, 33% better than regional average) places it beyond the design envelope of traditional utility efficiency programs.
Key Finding: Standard interventions (insulation upgrades, equipment replacement) would yield <5% additional savings at costs exceeding 20-year payback periods.
See UTILITY_PROGRAM_ANALYSIS.md for detailed analysis.
📬 Recent Updates
v1.4.0 (March 2026)
- Added February 2026 data and analysis
- Extended dataset to 50 months
- DHW optimization savings sustained at -22% YoY
- Runtime efficiency: 8.8 min/HDD (19% better than baseline)
- 2025-2026 heating season cumulative: 720 hrs / 4,529 HDD
v1.3.2 (February 2026)
- Added January 2026 data and analysis
- Extended dataset to 49 months
- Validated baseline under extreme cold conditions (1,230 HDD)
- Real-time monitoring integration documented
v1.2.1 (January 2026)
- Fully billing-aligned methodology implementation
- Four-year statistical validation complete
- Home Assistant real-time monitoring system deployed
📚 Citation
@misc{collis2026hvac,
  author = {Collis, William K.},
  title = {Residential HVAC Performance Baseline: A Five-Year Longitudinal Study in Climate Zone 5A},
  year = {2026},
  publisher = {GitHub},
  url = {https://github.com/wkcollis1-eng/Residential-HVAC-Performance-Baseline-},
  doi = {10.5281/zenodo.18232616}
}
🤝 Contributing
Contributions welcome! Particularly interested in:
- Comparative datasets from other climate zones
- Alternative SPC methodologies
- Dashboard improvements
- Multi-fuel system adaptations
See CONTRIBUTING.md for guidelines.
📬 Contact
- GitHub Issues: Open an issue
- Repository Owner: @wkcollis1-eng
Version: 1.4.0 (March 2026) Status: Active Baseline — 50 months of validated data Next Update: April 2026 (post-winter season summary)